This Halloween, the Geographic Information Systems (GIS) team at Giffels Webster would like to remind you that there is a bit of geo-awesomeness in everything you do and yes, that includes Halloween.
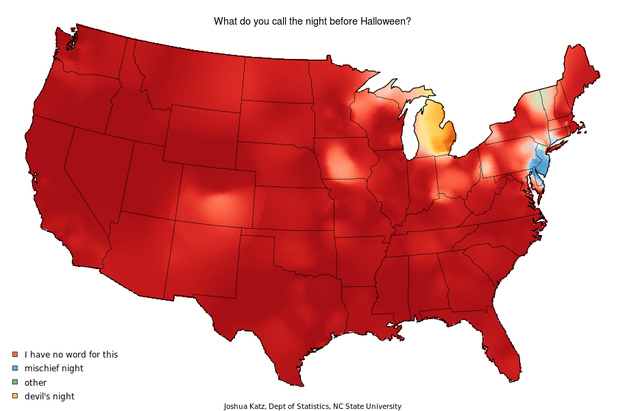
There’s, of course, an explosion of Halloween related maps, like this one that shows what the country calls the night before Halloween. It really puts Michigan on the map, huh?!
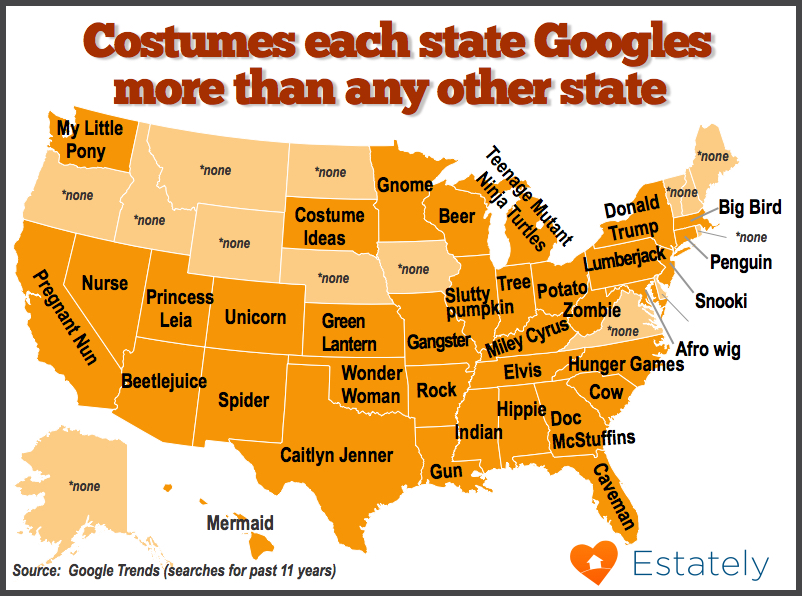
Or how about this one that maps the costumes that each state Googles more than any other state (you do you, Wisconsin).
A dentist’s favorite map – the map that breaks down cavity index – and its sister map that shows each state’s favorite Halloween candy.
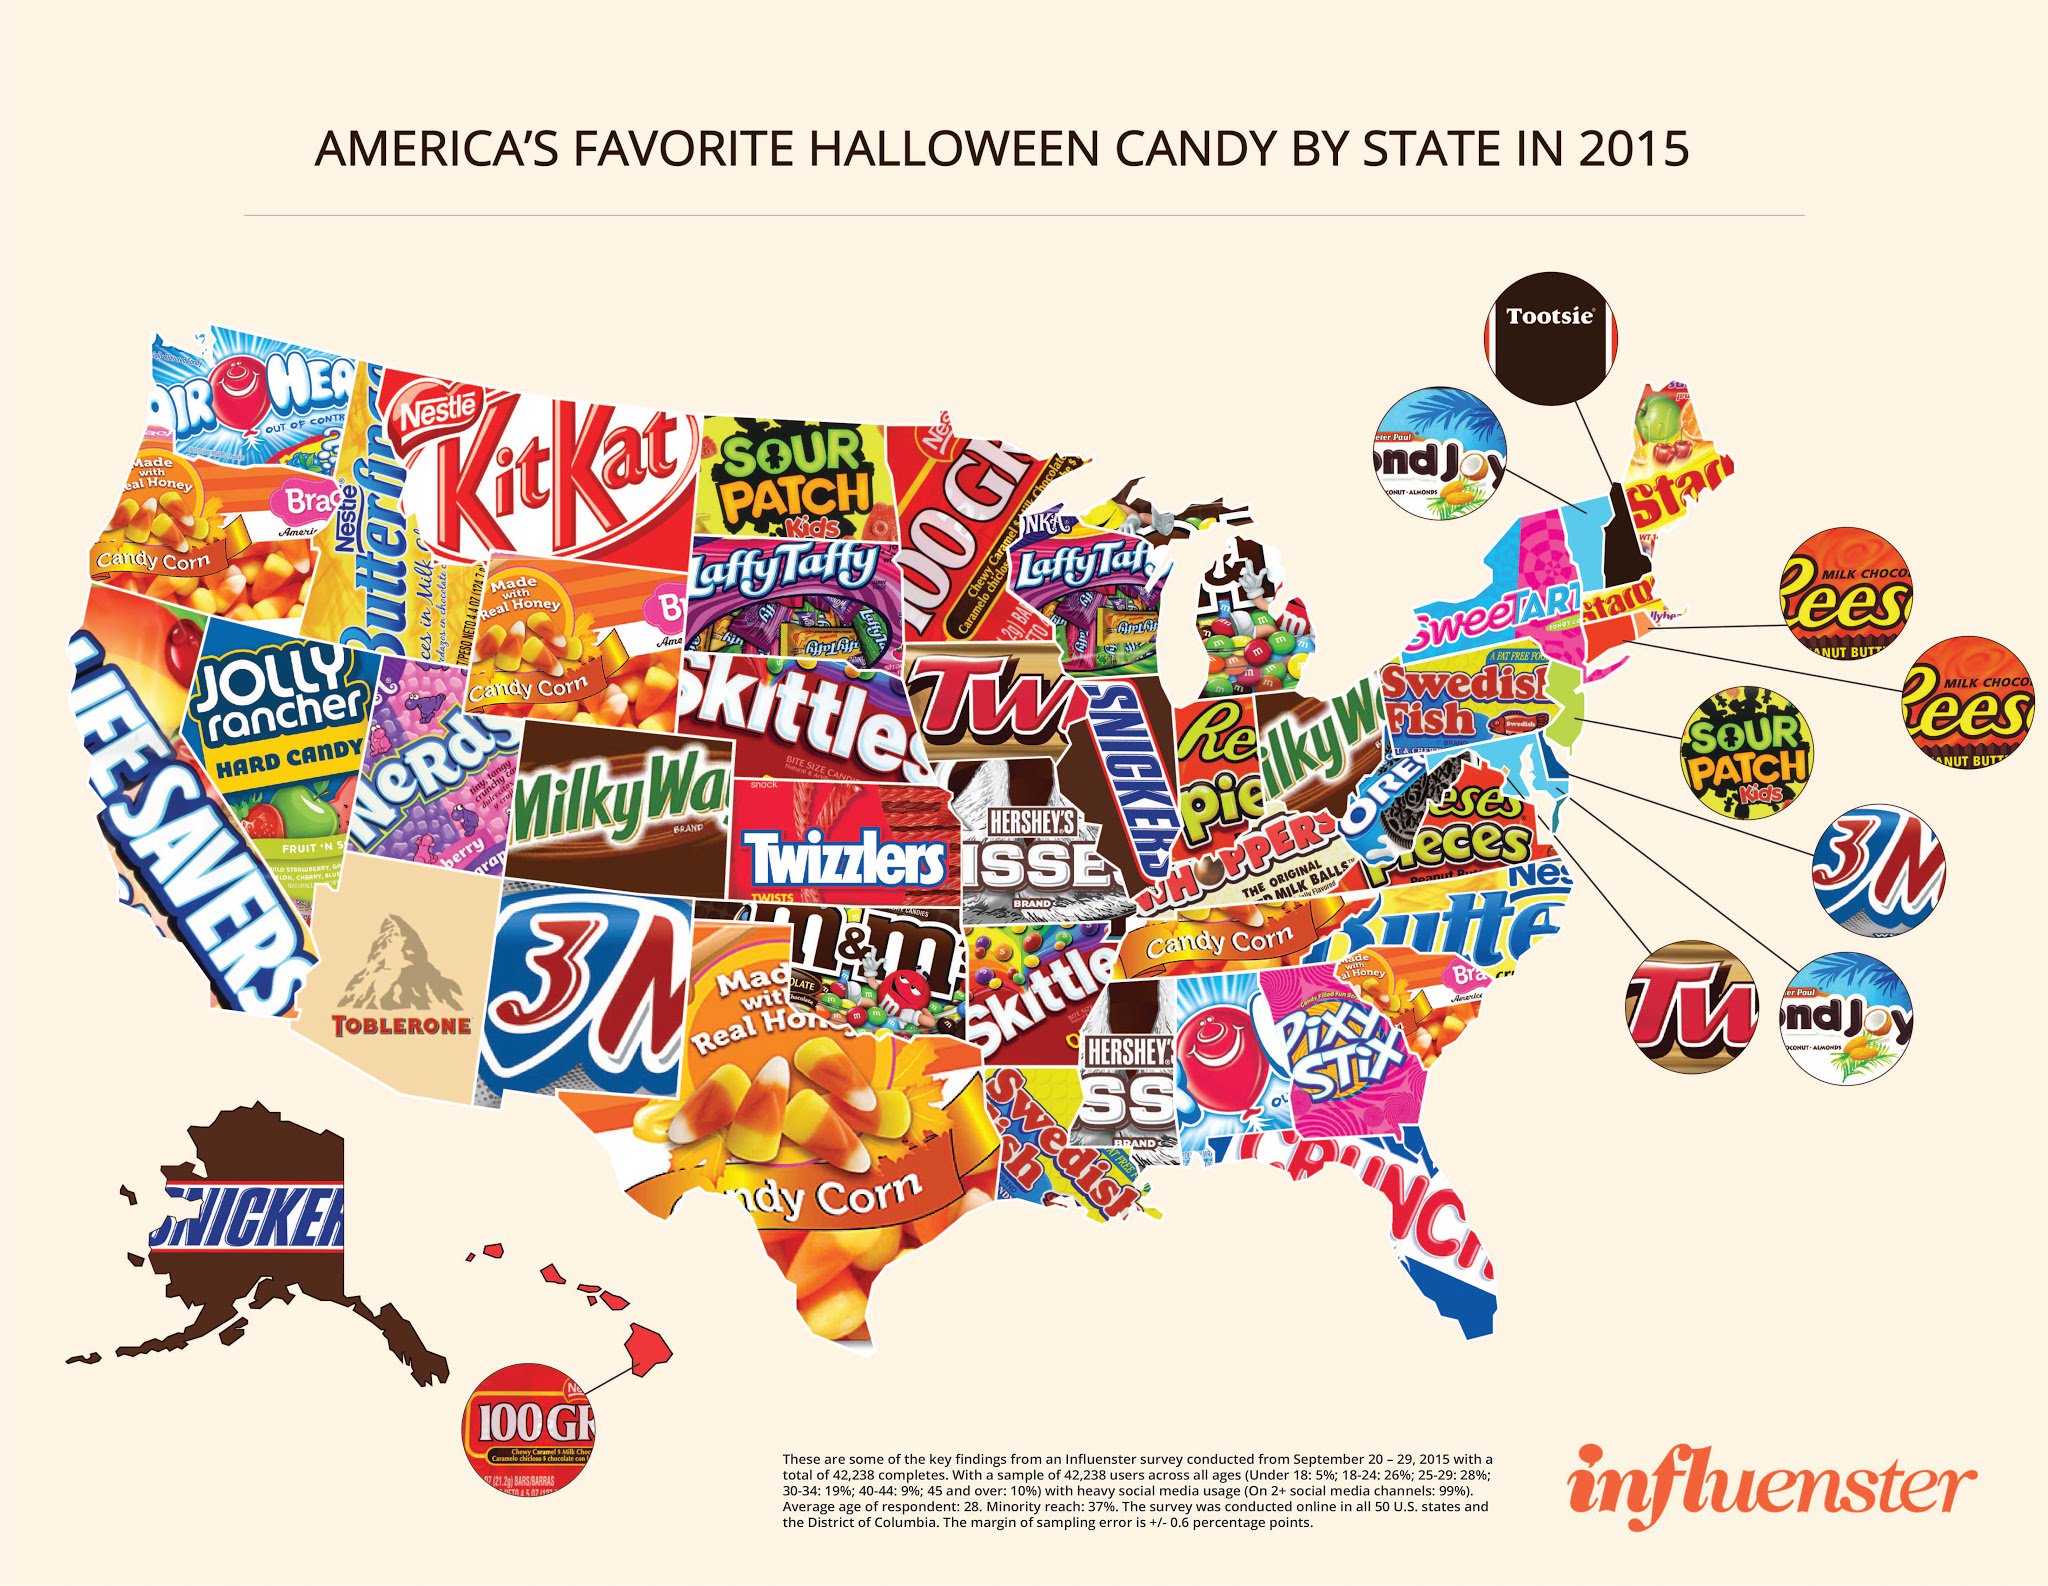
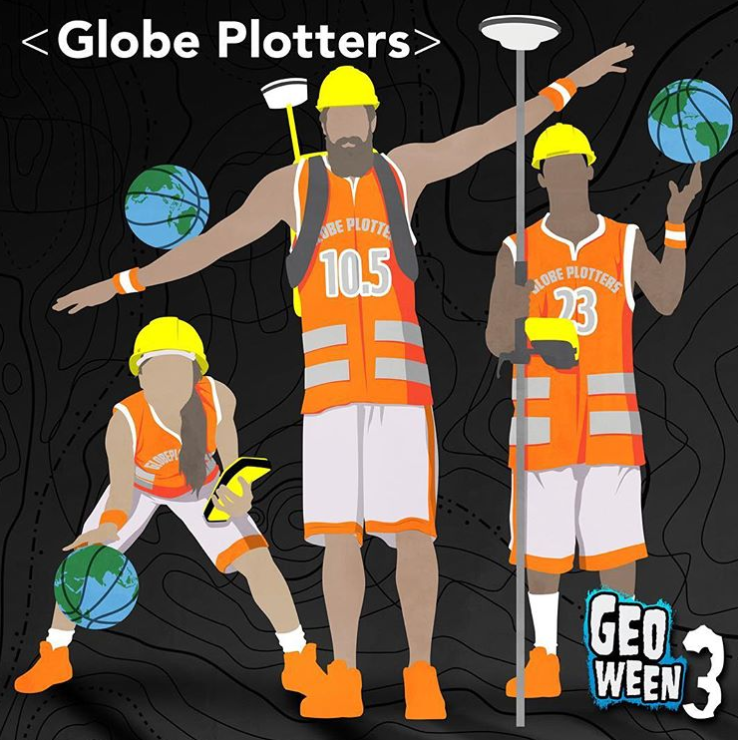
Our GIS team members created to celebrate the month:
But GIS (and urban planning) is here to make sure your Halloween is even sweeter. Want to know how to maximize your (kids’) trick-or-treating intake? Use GIS (and urban planning)! Check out this article that discusses how neighborhood design is a very important consideration… for candy intake. Your young ghouls will thank you when you’re trying to figure out where to go trick-or-treating! After all, time is candy.
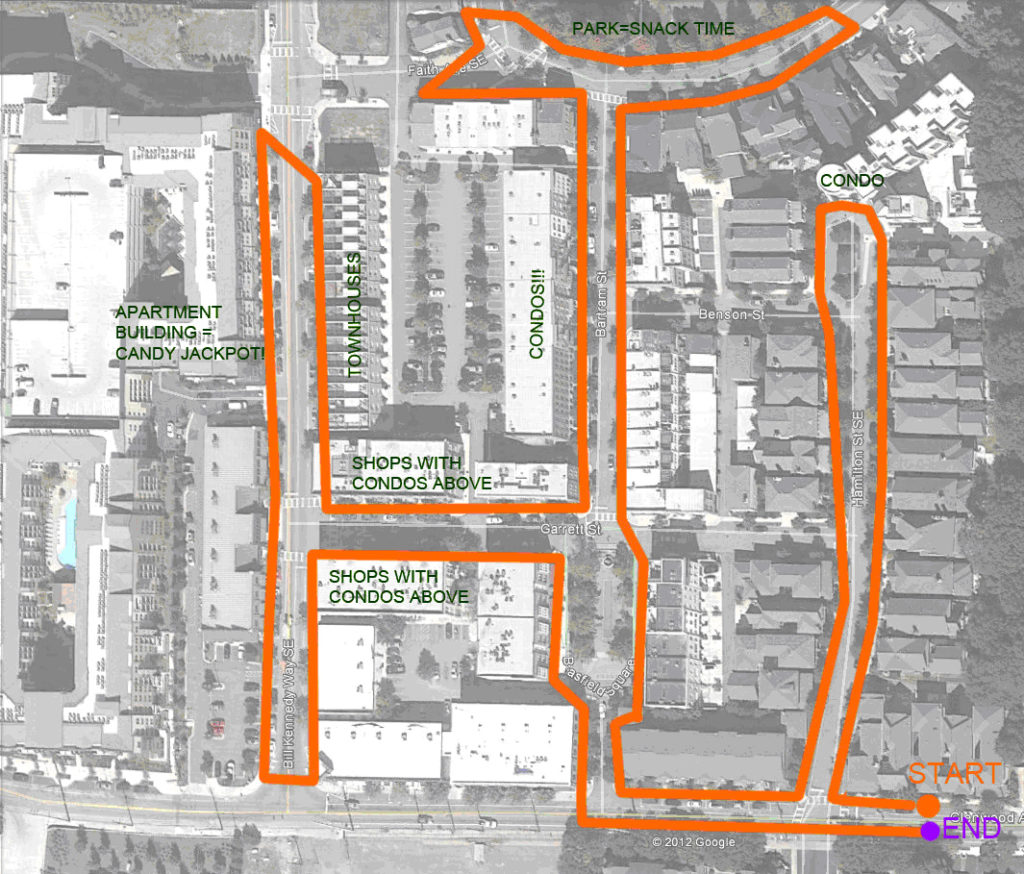 |
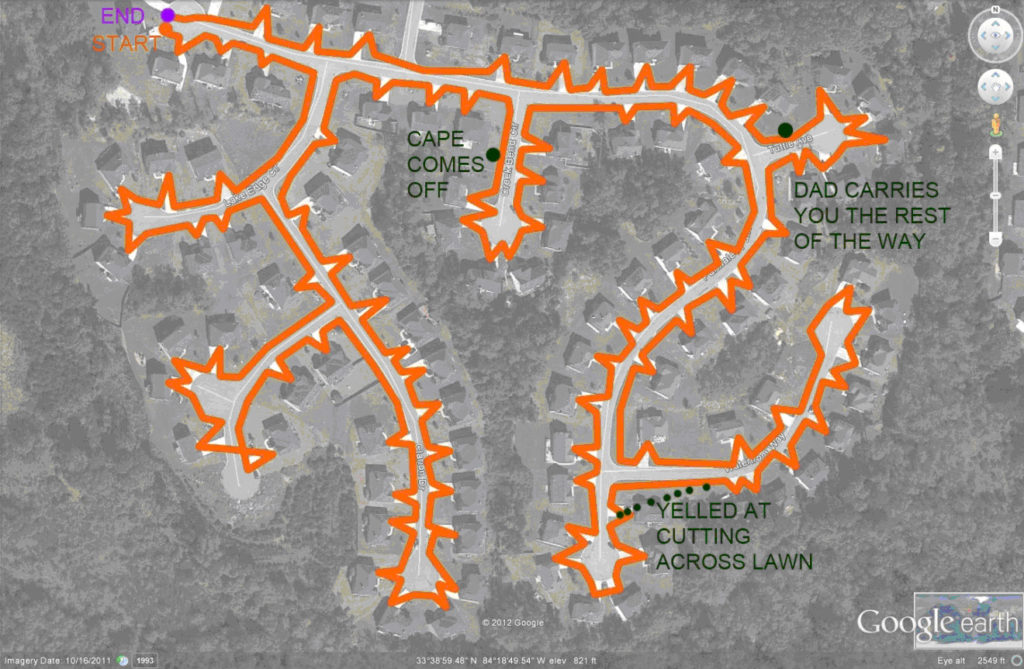 |
The above pictures from the article compare two neighborhoods (left a subdivision and right a mixed-use neighborhood) and calculated the potential candy score for each. We won’t spoil the article, but suffice it to say one of these two communities yields almost 5 times more candy than the other. Which one do you think it is?
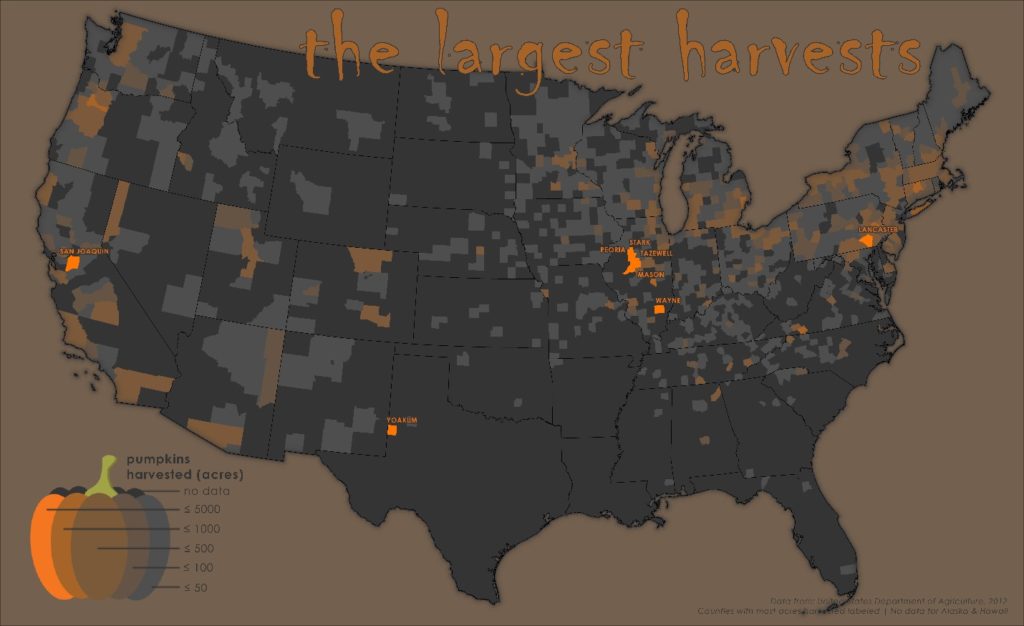
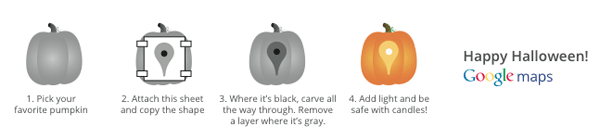
Something else to sink your teeth into are these pumpkin carving cutouts from Google. You can share your mappy Halloween spirit with your whole neighborhood!
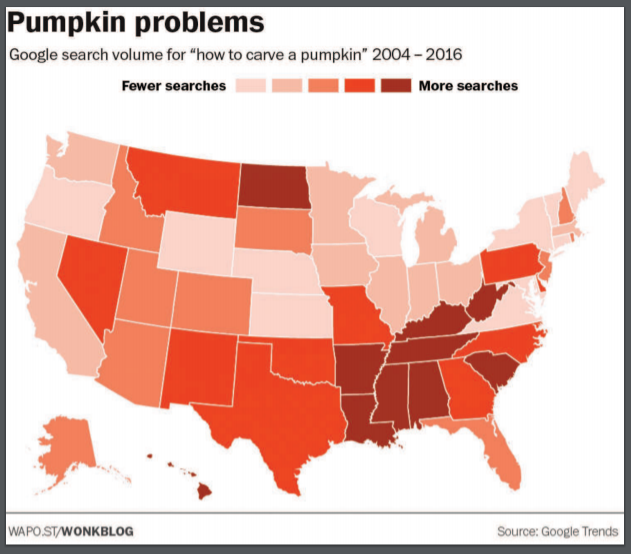
Now, we know you’re going to or have already carved a great pumpkin but how do we know? Another map told us, of course.
Apparently, Michiganders are so good at carving, we don’t have to Google instructions to do that!
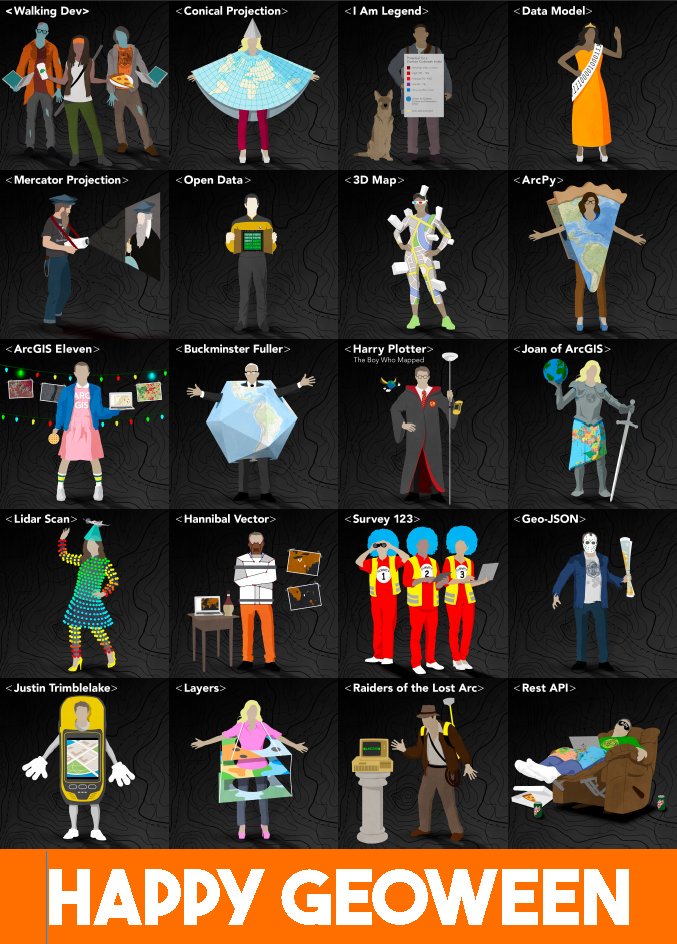
Have a Mappy Halloween, everyone! Now, please enjoy these punny geoween costumes compiled by Esri, starting with this one for our hardworking survey team.